Step-by-step guide to get the LogScale Collector running as a Windows service, enrolled in Fleet Management, and shipping Windows Event Logs.
Guidev4
Download v4Tested with LogScale Collector 1.11.x on Windows Server 2022.
Goal
LogScale Collector running as a Windows service, enrolled in your LogScale instance, shipping its first logs.
Prerequisites
- LogScale instance + permission to manage Fleet / create enrollment tokens
- Admin rights on the Windows host
- Outbound HTTPS from host to your LogScale URL
- (optional) Proxy information for the LogScale installation
Step 1 — Get the install command
Open Data ingest → Fleet overview and click Get LogScale Collector. In the popup, stay on Full Install, select Windows under (1), and leave Default Collector install token selected under (2).
Copy the PowerShell command. It looks like this:
& ([scriptblock]::Create((Invoke-RestMethod https://cloud.community.humio.com/api/v1/log-collector/install-collector.ps1 -Method POST -Body "<enrollment-token>")))
If you need a proxy for the download, add this to the PowerShell command in two places: one for Invoke-RestMethod, one for the install script.
-Proxy http://yourproxy.internal.com:8080
Your command after that should look like this:
& ([scriptblock]::Create((Invoke-RestMethod https://cloud.community.humio.com/api/v1/log-collector/install-collector.ps1 -Method POST -Body "<enrollment-token>" -Proxy http://yourproxy.internal.com:8080))) -Proxy http://yourproxy.internal.com:8080
→ You now have a one-line command containing your enrollment token.
Step 2 — Run the installer
On the Windows host, open PowerShell as Administrator, paste the command, and run it.
The script creates the required folders, downloads the LogScale Collector and the Collector Updater, and installs both. The enrollment token in the command tells the collector which FleetManagement instance to register with.
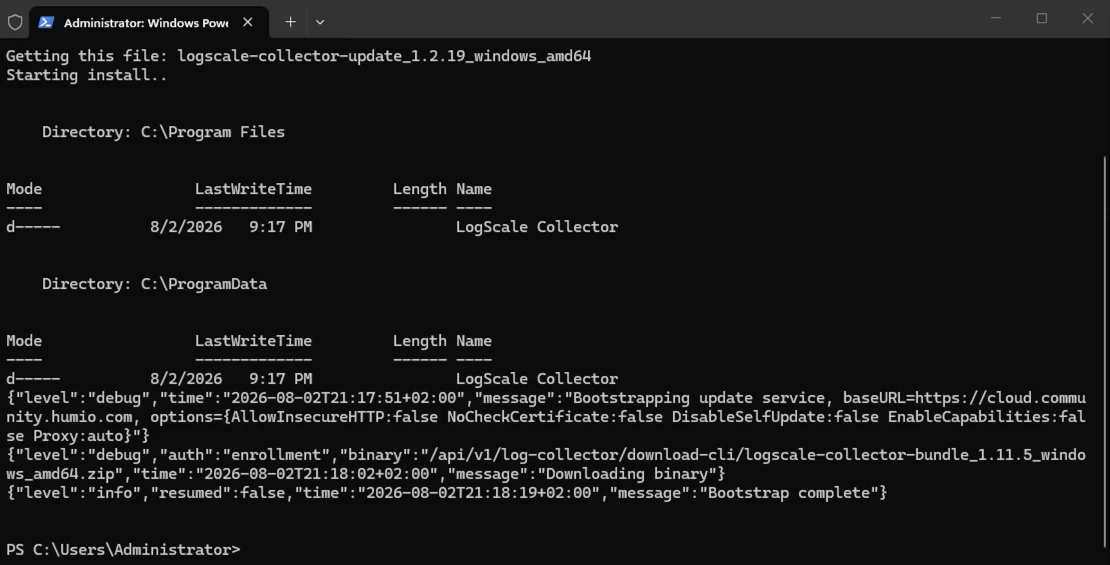
→ Expected: the service LogScale Collector shows as Running in
services.msc, and the host appears in Fleet overview within ~1 minute.
Step 3 — Create ingest token for repository
Go to Repositories and views and click the repository you want to use. In the repository, go to Settings → Ingest tokens and click on + Add token to create a new token. In the popup, enter a Token name and select WindowsEventlogs as parser. Next, click on Create token. In the list of tokens, click on the eye icon to show the newly created token. Copy the shown token.
→ Expected: Ingest token copied.
Step 4 — Create config for LogScale Collector
Open Data ingest → Config overview and click New config. In the popup enter a name for your config, e.g. windows-server, leave Empty config selected and click on Create new.
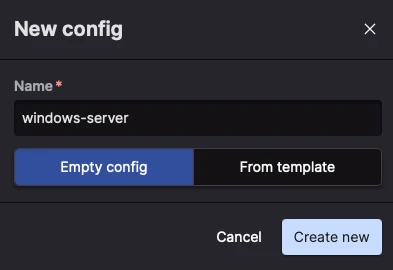
In the next window, you see a default empty configuration example for a generic Linux system:
sources:
  var_log:
    type: file
    include: /var/log/*
    sink: logscale
sinks:
  logscale:
    type: humio
    token: <ingest-token>
    url: https://cloud.community.humio.com
Replace the <ingest-token> with the ingest token you copied in step 3. Next, paste the following Windows config example under sources:, replacing the var_log block, to ingest all events from the Windows eventlog.
  windowsEvents:
    type: wineventlog
    sink: logscale
    channels:
      - name: Security
      - name: System
      - name: Application
If you copied all this together, your config in the end should look like this:
sources:
  windowsEvents:
    type: wineventlog
    sink: logscale
    channels:
      - name: Security
      - name: System
      - name: Application
sinks:
  logscale:
    type: humio
    token: <ingest-token>
    url: https://cloud.community.humio.com
Then click on Publish to save the configuration.
If you get asked Publish draft to all, click Publish draft to publish this to all the systems.
→ Expected: Config published.
Step 5 — Deploy config to the Windows system
Go to Data ingest → Fleet overview and search for the Windows system that was enrolled. Click on the three dots at the end of the line and select Switch config. In the popup, select the config windows-server and click Save. The LogScale Collector on the system will now download the new config and use it.
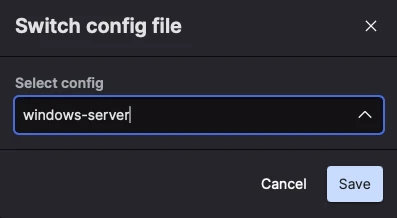
→ Expected: Enrolled server uses the config.
Verify it works
In Fleet overview, search for your host and check the Config name and Status columns.

To see the first events coming to the repository, go to Repositories and views and click on your repository. In the search field, enter this query to see the events ingested:
#windows.Channel = *
| groupBy([@collect.host, #windows.Channel])
→ Get this query: Windows events by host and channel — versioned, copy & download
With this you will get an overview of the servers, channels and the sum of events:
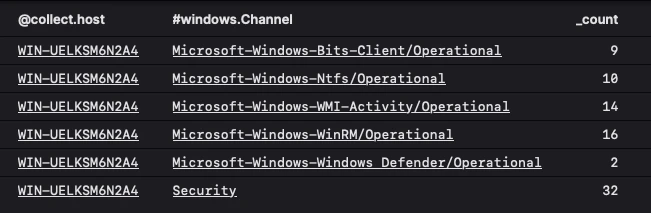
→ Expected: your new host shows up with all three channels and a rising event count within a minute or two. If it doesn't, see Troubleshooting below.
Troubleshooting
Host doesn't appear in FleetManagement
Diagnose it. Open a command prompt as Administrator, change to
C:\Program Files\LogScale Collector, and test the connection:
"LogScale Collector.exe" ping --cfg config.yaml
A working setup ends with All connection tests completed successfully!
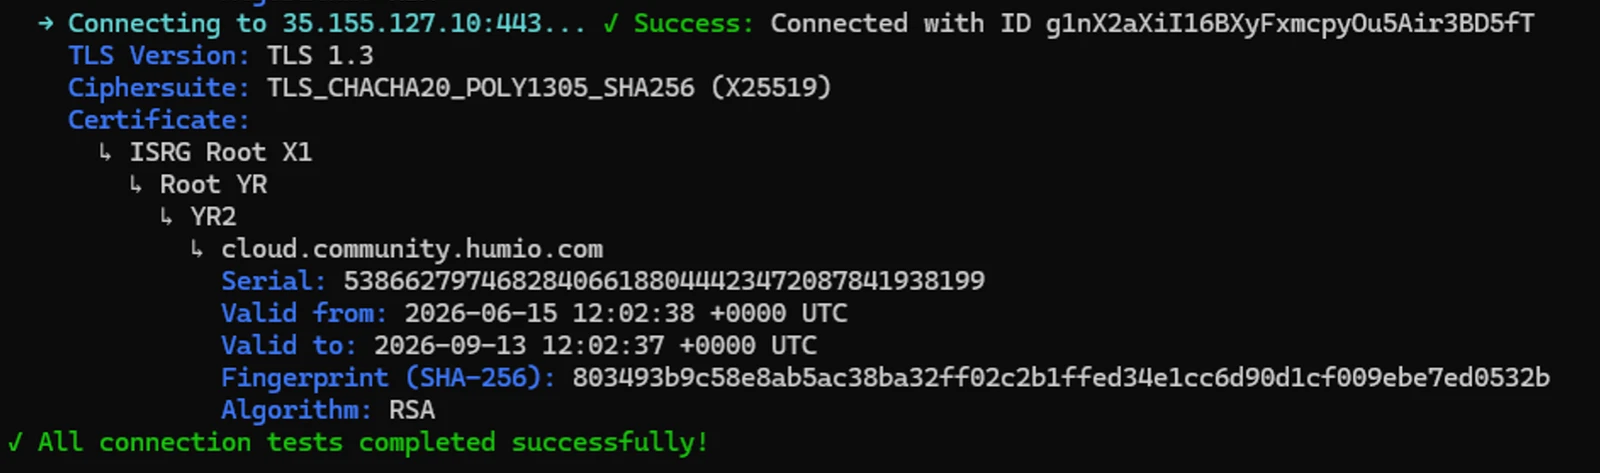
If it fails, the output tells you which of the two usual causes you're looking at.
Cause 1 — a proxy is in the way. The output shows a line like
Detected proxy URL: http://192.168.1.12 and the connection test fails.

Set proxy to auto in C:\Program Files\LogScale Collector\config.yaml — the collector then uses the system proxy settings. If the host has no proxy configured, set the URL explicitly instead.
dataDirectory: "C:\\ProgramData\\LogScale Collector"
fleetManagement:
  url: "https://cloud.community.humio.com"
  mode: full
  proxy: "auto"
Restart the service and run the ping again:
Restart-Service "LogScale Collector"
Cause 2 — wrong or expired enrollment token. The connection reaches
LogScale but is rejected (401). Generate a fresh install command
(Step 1) and run it again on the host (Step 2).
Service is running, but no events arrive
Diagnose it. Open a command prompt as Administrator, change to
C:\Program Files\LogScale Collector, and watch the collector's queues
and error counters:
"LogScale Collector.exe" monitor --cfg config.yaml
Press the down arrow to select a Component. The view updates live and
shows throughput plus HTTP client errors and HTTP server errors ---
which of the two is counting up tells you where to look.
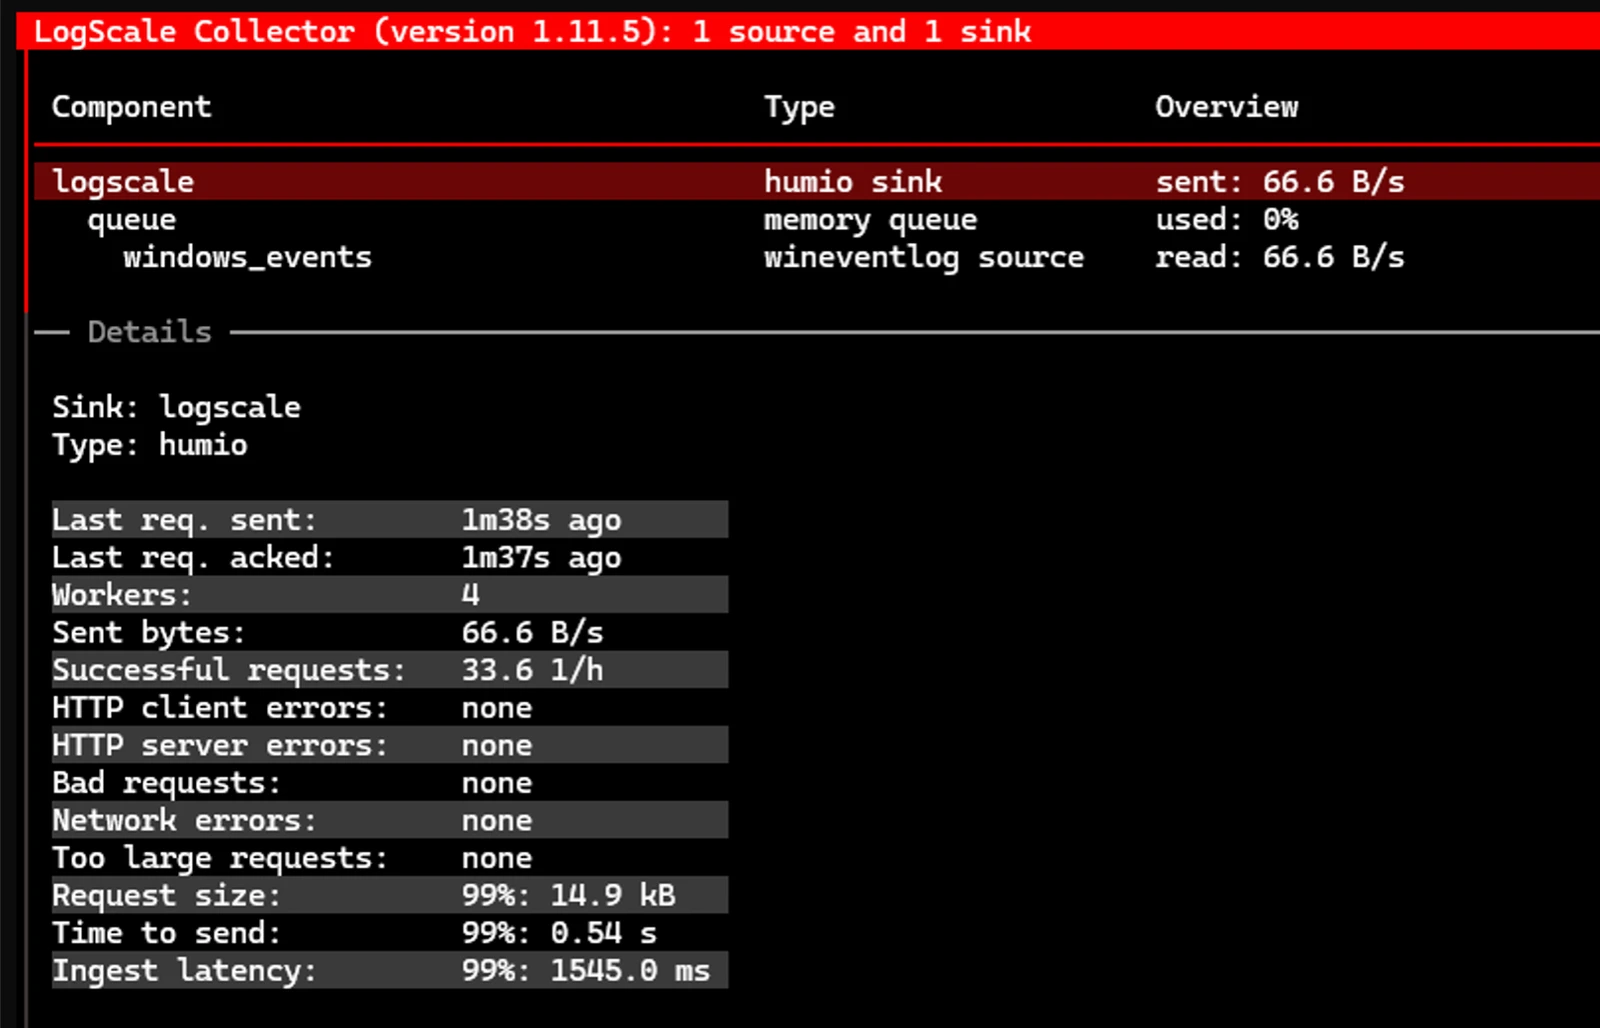
Cause 1 — client errors (4xx). LogScale is reachable but rejects the
data. Almost always the config: a wrong or revoked ingest token, or a
source pointing at a sink name that doesn't exist under sinks:. Compare
the config assigned in Fleet overview with the one you published in
Step 4, fix the token or sink name, publish again, and re-deploy it to
the host (Step 5).
Cause 2 — server errors (5xx) or no traffic at all. The instance or the network path is the problem, not your config. Re-run the connection test from the previous section:
"LogScale Collector.exe" ping --cfg config.yaml
Version history
By default each save creates a new version. Overwrites update the current version in place. Open any version to view or download it.